Stellar Photometry
In the second century BC, the Greek astronomer Hipparchus, introduced a system where the brightest star in each constellation was classified as first magnitude. In 140AD Ptolemy refined Hipparchus' system by using a brightness scale of 1 to 6 where the brightest stars were called Magnitude 1 and the faintest, that is those just visible to the naked eye, Magnitude 6. This scale is still used today having been extended to objects fainter than 6th magnitude and brighter than 1st magnitude. Accurate measurement of magnitudes, however, was only made possible in the 20th century through the advent of photoelectric devices.
Stellar photometry is that branch of astronomy that deals with the accurate measurement of the brightness of stars and the changes in their brightness over time. It probably had its beginnings in the 18th Century with the techniques introduced by Bouger in 1729 and Lambert in 1760. The era of well-determined, reproducible measure-ments may be considered as starting in 1850 when Podgson defined an increase of 1 magnitude as equivalent to a decrease in brightness of 0.4. Following this Zollner constructed the first visual stellar photometer in 1861. Photographic photometry was introduced in 1904 and the international photoelectric system of Johnson and Morgan was established in 1951.
As photoelectric devices, such as photomultiplier tubes, photodiodes and charge-coupled devices (CCDs), have replaced the photographic plate and visual equipment in professional observatories, any discussion of the accurate measurement of starlight now focuses on techniques using these devices.
Photoelectric Devices
Photoelectric detectors convert light into an electrical signal. There are three detector types: the photomultiplier tube, photodiode and charge-coupled device (CCD).
The photomultiplier (Figure 1) is a vacuum-tube device with a special surface that gives off electrons when light falls on it. A chain of diodes at different voltages gives rise to a cascade of electrons thus multiply ing the original signal a million times or more. Photomultiplier tubes have high gain and low noise but are prone to damage (both mechanical and through exposure to very bright light) and respond to only a limited range of wavelengths.
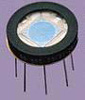
In contrast the photodiode is a solid-state semiconductor device (Figure 2). Light falling on it causes electrons to flow in the 'conduction band' of the semiconductor material. Photodiodes are cheap, robust and respond to light from the ultraviolet through to the infrared but are not as sensitive as photomultiplier tubes. The avalanche photodiode is a different type of solid-state detector that not only detects the light falling on it but also amplifies the signal generated by a factor of fifty or more.
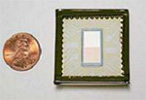
More recently astronomers have turned to CCDs (Figure 3). These are solid-state devices with an array of picture elements called pixels. Each pixel is a tiny detector - a CCD array can have tens of thousands to one million or more pixels! In addition to providing excellent images of astronomical objects in much shorter exposure times than photographic film, the charge accumulated in each pixel from light falling on it can be readout and measured. In this way the magnitudes of stars can be measured accurately. CCDs are very sensitive, respond to light over a wide range of wavelengths from the ultraviolet to infrared, and can measure many stars at once in contrast to photomultiplier tubes and photodiodes that measure one star at a time.
Measuring Colours
The difference in colours of stars can be seen visually but measuring such differences can tell us about the lives and times of stars. By carefully choosing filters that isolate certain wavelengths of light astronomers determine the luminosities, surface temperatures and gravities of stars and infer changes in radius and differences in chemical composition. For binaries their orbital dynamics can be determined from the light curves obtained through photoelectric measurements.
The most common system in use is that introduced by Johnson and Morgan in 1951 known as the UBV system. It comprises three wavelength bands isolated using ultraviolet, blue and green filters.
Since its initial introduction it has been extended to include red (R) and infrared (I) bands. Of particular importance are measurements in the V band that can be related to a star's intrinsic brightness (luminosity), and the B-V colour index, formed by taking the difference in measurements in the B and V bands. The B-V colour index serves as a good indicator of a star's surface temperature.
Looking Through the Atmosphere
The Earth's atmosphere affects the starlight that passes through it. In addition to dimming stars, it changes their colours and introduces fluctuations in brightness.
There are random fluctuations in both the observed position and intensity of a star. The latter is known as scintillation and commonly referred to as 'twinkling' of stars. Usually astronomers refer to both effects collectively as 'seeing' and estimate how good or bad the observing conditions are by noting the apparent size of the image of a star in seconds of arc.
In photoelectric photometry an estimate of the quality of the observing can be made by taking a series of consecutive measurements then calculating how much they vary from an average value.
Where the variations are 1% or less (corresponding to about 0.01 magnitude), the conditions are considered to be 'photometric'.
As stars rise or set their brightness changes because they are being viewed through different thicknesses of atmosphere. Figure 4 illustrates this - the scale used is 'air masses' where an air mass = 1 corresponds to the thickness of atmosphere through which a star is seen when it is overhead, i.e. at a Zenith angle of 0º
This change in the measured brightness of a star as it is viewed through different thicknesses of atmosphere must be corrected for. Because the transparency of the atmosphere may change from night to night measurements are corrected, not to an air mass = 1, but to the magnitude that would be observed in the absence of the atmosphere (i.e. air mass = 0). How much easier would photo-electric photometry be on the Moon!
References
- AAVSO 2001, Manual for Visual Observing of Variable Stars, American Association of Variable Star Observers, Cambridge, Massachusetts, USA, Revised Edition - January 2001.
- Douglas George 1995, 'Starting Out Right', CCD Astronomy, pp. 18-23, summer.
- Kenneth J. Kaufmann 2000, 'Light Levels and Noise Guide: Detector Choices', Photonics Spectra, July.
- Albrecht Unsöld 1969,The New Cosmos, Springer-Verlag, New York.