A high resolution Barometer
by Blair, June 2023
A high resolution ‘fast’ sampling barometer,
The described barometer uses the Bosch BME280 sensor and has a 24 bit digitizer that achieves a resolution of 0.2 Pa (equivalent to a height change of 1.7cm!) at a sample rate of 1 sample every second. For those familiar with the old imperial measurement system of inches of mercury, standard atmospheric pressure at sea level is around 30 inches of mercury and this sensor can resolve 1 millionth of an inch of mercury pressure change!
The overall accuracy according to the manufacturer’s specification is typically +- 0.25%, that is approximately a 1 metre height change.
The data sheet for the BME280 sensor is here and the device is available as a pre built module suitable for Arduino’s and Raspberry Pi computers from Australian suppliers such as Core Electronics, Altronics and Jaycar for ~$15 marketed as a PiicoDev device (CE07503) from Core Electronics or for ~$35 on the board from Jaycar (Xc3702) shown below.
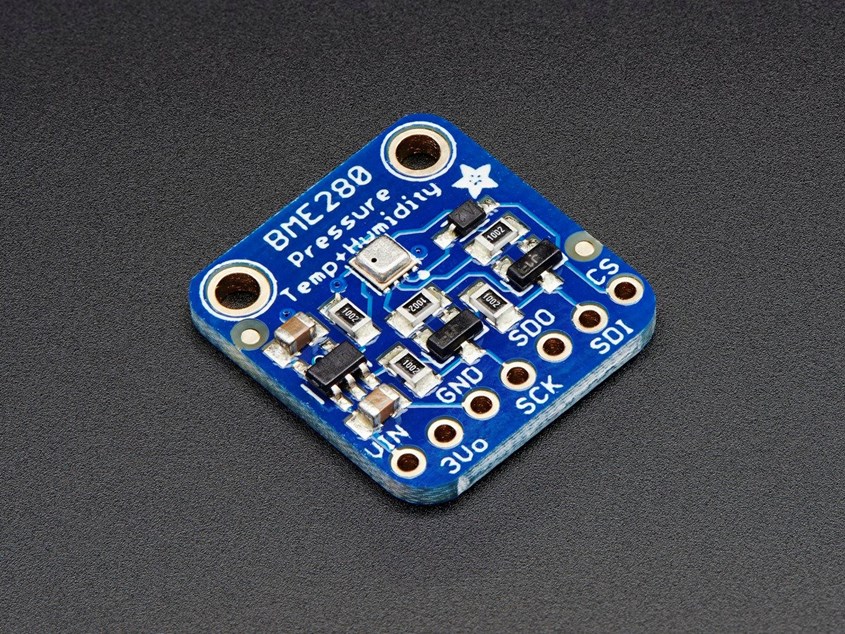
The actual sensor is the little square silver can with the tiny hole in it.
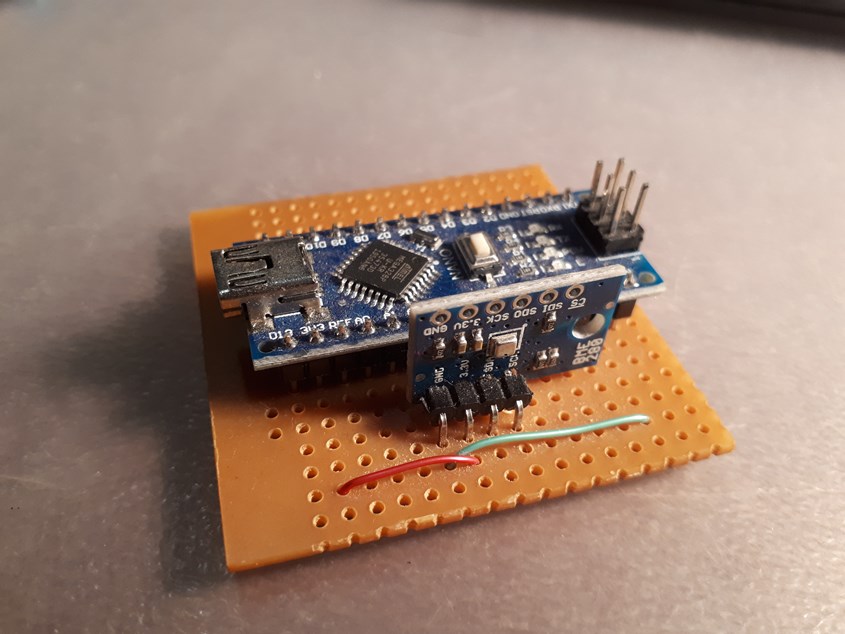
I built mine around an Arduino nano module which is available from the above suppliers as well.
The module communicates with the Arduino via the very common i2c buss / protocol and there are libraries available to assist the hobbyist in writing suitable code to interrogate the sensor, which can output barometric pressure, humidity and temperature.
The code to ‘extract’ the data from the module and send a serial string out the USB port is very simple and is written in ‘C’
So why build a barometer with such a ‘fast’ sample rate of 1 sample every second?
Weather changes are not that fast.
Some times, it is nice to have the fast data, you can always throw away data or resample it to a lower / slower sample rate, You never know what you might miss.
Some weather related phenomenon can generate very interesting pressure waves that will travel for many km.
In the Northern Territory there is a rare and unique weather feature called ‘morning glory’, you can read about it here.
See https://en.wikipedia.org/wiki/Morning_Glory_cloud

From the Wikipedia page,
“The Morning Glory cloud is a rare meteorological phenomenon consisting of a low-level atmospheric solitary wave and associated cloud, occasionally observed in different locations around the world. The wave often occurs as an amplitude-ordered series of waves forming bands of roll clouds.
The southern part of the Gulf of Carpentaria in Northern Australia is the only known location where it can be predicted and observed regularly due to the configuration of land and sea in the area.
I used to observe and record these waves passing through the Warramunga Seismic Station in Tennant Creek when I was stationed there in the late 1970’s, the waves can travel for over 1000 km across the land.
They are occasionally seen in Spencer Gulf in South Australia.
Large volcanoes erupting can also generate very large pressure waves that have been known to circle the planet several times.
The Hunga Tonga-Hunga_Ha’apai eruption in December 2021 was spectacular and 'shook the world's atmosphere' see
https://en.wikipedia.org/wiki/2022_Hunga_Tonga%E2%80%93Hunga_Ha%CA%BBapai_eruption_and_tsunami for an excellent write up on the event.
This severe volcanic eruption produced a massive air blast that resulted in ‘Lamb Waves’ being generated, these are a type of soliton (solitary wave) similar to the Morning glory clouds and these pressure waves from the Hunga Tonga Volcano, traveled outwards from the volcano and were detected all around the globe.
People in northern Queensland actual heard the sounds as a very low frequency rumble.
In South Australia, quite a few people who own weather stations also saw the pressure wave as it passed.

The above ‘trace ‘ is of the pressure wave recorded by my high resolution , high sample rate barometer as it passed over Adelaide.
The pressure change was in the order of 4mb of amplitude.
The relatively high sample rate of 1 sample per second really paid off, our overseas collaborators were 'very enthusiastic' to have the data at such a high sample rate, as most weather stations only record a sample every 10 minutes!
For a more detailed report on the event see here.
While I have described the sensor, one also needs to be able to record the data onto a computer so that we can have a copy to analyse in the future.
I have written a short python script that receives the data over the USB port and records it in a usable format.
The recorded file is a text file with some header information that our overseas collaborators from the Royal Observatory of Belgium can use when they analyse the data using their software called Tsoft
Tsoft is freeware and ideally suited to analyzing very large data files that are typically found in environmental data logging that encompass potentially years of data..
The python script to record the data can run on a windows PC or a raspberry Pi and connects to the barometer sensor via a USB connection. Each daily file is around 3mb in size.
I hope our readers might find the above interesting and useful.
Blair blair.lade@gmail.com